While private equity and infrastructure investments offer the potential for attractive returns, their journey is rarely a smooth one. The J-curve, a widely used visual representation, captures this unique path, highlighting the initial negative returns followed by a gradual ascent towards potentially significant positive outcomes. Delving into this concept and its nuances is crucial for investors contemplating venturing into these exciting yet sometimes perplexing asset classes.
The Shape of the Curve
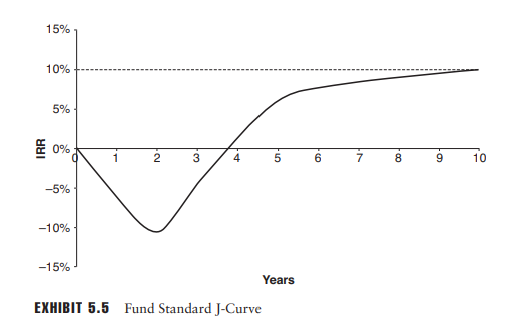
Imagine a graph charting returns over time. Initially, the line dips into negative territory, depicting the early years of an investment. This decline primarily stems from two factors:
Deployment Fees and Expenses: Private equity and infrastructure funds charge upfront fees for management and other operational costs. These fees are calculated on committed capital, even before investments are made, leading to negative returns in the initial period.
Investment Activity and Value Creation: During this phase, funds actively deploy capital into target companies or projects. While value creation is underway, tangible returns are yet to materialize.
As time progresses, the curve starts to flatten and eventually rises above the x-axis, signifying positive returns. This upward trajectory is powered by several forces:
Earnings Growth and Cash Flow: The underlying investments mature, generating profits and distributing cash flow to the fund.
Valuation Increases: As businesses grow and projects progress, their underlying value appreciates, leading to capital gains upon eventual exits.
Exit Strategies: When investments are successfully sold or liquidated, the accumulated returns are distributed to investors, contributing significantly to the positive side of the J-curve.
Factors Influencing the J-Curve
While the overall J-curve shape holds true, its specific characteristics can vary depending on several factors:
Investment Strategy: Core and value-oriented strategies often exhibit smoother J-curves with lower initial dips and steadier climbs. Conversely, growth and turnaround strategies may have deeper initial falls and steeper subsequent rises.
Asset Class: Infrastructure projects typically have longer investment horizons and construction phases, leading to a more prolonged initial decline and delayed positive returns compared to private equity investments in established companies.
Fund Structure and Fees: Funds with higher management fees or carried interest structures will see a steeper initial decline in the J-curve, as a larger portion of early cash flows goes towards these fees.
Navigating the J-Curve
Understanding the J-curve empowers investors to approach private equity and infrastructure investments with realistic expectations and informed decisions:
Long-Term Commitment: These asset classes demand a long-term investment horizon, typically 5-10 years or even longer. Investors must be prepared to weather the initial negative period and trust the value creation process.
Risk Tolerance: The initial decline can be significant, requiring investors to have a robust risk tolerance and a diversified portfolio to absorb potential short-term losses.
Performance Benchmarking: J-curve comparisons should be based on relevant benchmarks within the same asset class, strategy, and vintage year to account for normal variations.
Professional Guidance: Experienced advisors can help investors navigate the intricacies of the J-curve, select suitable funds, and manage their expectations throughout the investment cycle.
Beyond the J-Curve
While the J-curve provides a valuable framework, it’s crucial to remember that it’s a simplified representation. Numerous other factors like economic cycles, individual asset performance, and unforeseen events can impact the actual returns path.
Overall, the J-curve serves as a helpful guide for understanding the unique investment journey of private equity and infrastructure. By acknowledging the initial decline, appreciating the drivers of future returns, and making informed decisions, investors can navigate this rollercoaster with a stronger chance of reaching the final destination of positive outcomes.
Other Resources
Corporate Finance Institute Definition