Alternative.Investments
  • News & Strategy
  • Data
    • Alternative Investments Pro Membership
      • NT BDC Pro
      • NT REIT Pro
    • NT REIT Assets
    • NT BDC Assets
    • NT BDC Registrations and Launches
    • Conglomerates/Opcos/Other Alternative Funds
    • Interval Fund Data
  • Fund Structures & Asset Classes
    • 1031 Exchange
    • Accredited Investor
    • Interval Fund
    • J-Curve
    • Non-traded BDC
      • Perpetual-Life Non-traded BDC
      • Private BDCs
    • Non-traded REIT
    • Qualified Opportunity Zone Funds
    • Qualified Purchaser
    • Regulation Best Interest (Reg BI)
    • Tender Offer Fund
  • About
    • Contact
  • Log In to Pro
Fidelity Alternative Investments

Fidelity Will Open Up New Distribution Channels for Alternative Investments

Fidelity’s registration of a non-traded BDC and an interval fund represents a watershed moment for the alternative investments sector. In a prior article we examined the structural and strategic differences between these two funds. In this article we will discuss the broader meaning for the investment management industry.

First of all, Fidelity is gigantic compared to NT BDC and Interval Fund sector. In order to move the needle at all, Fidelity will need to raise one of the largest BDCs and Interval Funds. According to its website, Fidelity has a total of $3.7 trillion in discretionary assets under management, mostly in mutual funds and ETFs. Compared to these traditional markets, the NT BDC and interval fund sectors are almost comically small.

Total assets in the NT BDC market are ~$124 billion, and the total assets in the interval fund market are $60 billion. If Fidelity were to raise enough capital to double the size of the BDC and interval fund markets, their new funds would still account for less than 5% of their AUM.

Of course BlackRock, which has over $9 trillion in AUM is also active in the retail alts space, with three non-traded BDCs and two interval funds. Yet there is another unique angle to the Fidelity story.

Fidelity is more well known for its equity mutual funds, but its entrance into this niche indicates that they recognize that alternative investment strategies are essential components of a diversified portfolio. Fidelity will be expanding the alternative investments market, rather than just competing with other asset managers.

See also: Why Traditional Asset Managers Need Alternative Investments

To learn more about new BDC registrations and launches click here.

To access a list of NT BDCs currently active in the market, click here.

Interested in accessing detailed information on fund fees, asset growth, and performance history? Sign up as an Alternative Investments Pro Member.

Fidelity BDC and Interval Fund

Fidelity Launches Non-traded BDC and Interval Fund

Fidelity is entering the alternative investment market with the registration of two new funds: one Non-traded BDC, and one interval fund. Fidelity Private Credit Fund is a non-traded Perpetual Life BDC that has an initial registration statement on September 6, 2022, and an updated draft on October 28, 2022. Fidelity Multi-Strategy Credit Fund is an interval fund that filed a draft registration statement on October 11. Both funds are still pending effectiveness from the SEC.

In this article we take a closer look at Fidelity’s new BDC and Interval Fund, and speculate on some of the broader implications of Fidelity’s entrance into the alternative investments market.

Fidelity BDC Fee Structure

Fidelity Private Credit Fund is targeting a maximum capital raise of $1 billion, and a minimum capital raise of $100 million. It will hold investor’s funds in interest- bearing escrow accounts until they receive purchase orders for at least $100 million in any combination of share classes. Based on expressions of investor interest, they expect to hold a first closing and break escrow in 2023Q1. Fidelity’s new BDC will have a base management fee of 1.25% per year. Additionally, it will charge an incentive fee consisting of two parts. The first part of the incentive fee is based on income- the manager will receive 12.5% of pre incentive fee net investment income over a 5.0% hurdle rate. Additionally, the fund will pay the manager 12.5% of cumulative realized capital gains.

Fidelity Distributors Company , LLC will conduct the non-traded BDC offering, and won’t charge any sales load. Some financial intermediaries may charge sales loads or placement fees for for S,and D shares, although total amount cannot exceed 3.50% for Class S and 1.50% for Class D. Servicing/distribution fee will be 0.85% for Class S shares and 0.25% for Class D shares.

Fidelity Interval Fund Fee Structure

Fidelity Multi-strategy Credit Fund plans to conduct a continuous offering for an unlimited amount of shares. The draft prospectus for Fidelity’s Interval Fund still needs several details to be filled in. In particular, the management fee amount is not yet specified. It will have two share classes: Class A and Class I. Minimum investment will be $1,000,000 for Class I. Minimum investment for Class A is not yet specified. Most likely it will be a retail share clas with a low (ie $2,500 or lower) minimum investment. Fidelity Distributors Company, LLC will also conduct the interval fund offering.

Fidelity BDC and Interval Fund Strategy Comparison

Fidelity’s BDC and interval fund are both credit focused , but there are important differences between their strategies. As a BDC, the Fidelity Private Credit fund will invest at least 70% of assets that meet regulatory requirements of the BDC structure- generally this will mean U.S. firms with market values of less than $250 million. BDC portfolio companies are generally private and sponsor backed, but they might also be small cap public companies. Fidelity Private Credit Fund will primarily focus on directly originated loans to private companies but will also invest in syndicated loans and other liquid credit investments. Fidelity Private Credit Fund has the official objective of: “Generate current income and, to a lesser extent, long term capital appreciation”

Fidelity’s interval fund will invest in a broader range of credit assets as the name “Fidelity Multi-Strategy Credit Fund” implies. According to the registration statement, it will invest opportunistically in various credit instruments. The foundational credit assets will include direct lending, real estate debt, leverage loans,h high yield bonds, collateralized loan obligations. Fidelity’es interval fund will also make opportunistic credit investments in distressed debt, special situations, convertible bonds, preferred stocks, and privately originated dals. The investment objective for Fidelity’s interval fund also reveals a broader mandate: “Provide a high level of current income and capital appreciation through investments across a variety of high-income oriented asset classes including both liquid and illiquid securities.”

See also: Fidelity Will Open Up New Distribution Channels for Alternative Investments

To learn more about new BDC registrations and launches click here.

To access a list of NT BDCs currently active in the market, click here.

Interested in accessing detailed information on fund fees, asset growth, and performance history? Sign up as an Alternative Investments Pro Member.

Strategic Realty Trust

Strategic Realty Trust Tender Offer

Alternative Liquidity Capital has announced an offer to purchase up to 1,050,000 shares of Strategic Realty Trust, Inc.(SGIC) at a price of $0.75 per share. Offer documents are available on the SEC EDGAR database and at Alternative Liquidity’s website. In this article we provide some background information on SGIC, and the offer.

Strategic Realty Trust Background and History

SGIC is a non traded REIT that had the unfortunate timing of launching in early 2009. Consequently, it only raised $100 million, far below what it originally targeted. In 2013 a new external advisor took over management.

Strategic Realty Trust is not currently paying distributions, and there is no assurance that it will pay distributions in the future.

According to the form 10-K for the year ended December 31, 2021:

We are uncertain of our sources for funding our future capital needs and our cash and cash equivalents on hand is limited. If we cannot obtain debt or equity financing on acceptable terms, our ability to acquire real properties or other real estate-related assets, fund or expand our operations and pay distributions to our stockholders will be adversely affected.

On the other hand, SGIC recently sold one of its properties, according to an 8-K filed on October 17, 2022. That may free up some cash to start making distributions soon.

Liquidity Options for Strategic Realty Trust Shareholders

SGIC shareholders have been stuck for a long time with limited liquidity options. The share repurchase program has been suspended for normal circumstances since 2015, and since 2020 it has also been suspended even for cases of death/disability. Secondary trading in the shares has been extremely limited. In September and October 2022, CTT Auctions reported 3 separate auctions for small blocks of shares at prices ranging from $0.76 to $0.78 per share.

SGIC investors seeking liquidity should discuss the tender offer with their financial advisor before making a decision.

About Alternative Liquidity Capital

Alternative Liquidity Capital will also purchase other non-traded alternative investments. If you have questions about the Strategic Realty Trust Offer, or you have other illiquid assets you are looking to sell please contact info@alternativeliquidity.net

StHealth Capital Investment Corp Logo

StHealth Capital Investment Corp

STHealth Capital Investment Corp has a sordid history. Some investors knew it as Freedom Capital, others knew it as First Capital Investment Corp. Probably all have been stuck in the investment for years. Now at last, there is an opportunity for long suffering investors to get some cash out and exit their investment. But first lets start with the history.

STHealth Capital Investment Corp History

Originally known as Freedom Capital, StHealth Capital Investment Corp launched in 2015, and raised a small amount of capital in the independent broker dealer space. But it didn’t get critical mass, and another sponsor took over the management contract around 2018. Then the SEC sued this sponsor for self dealing and making material misrepresentations among other crimes, and banned its CEO from the securities industry(a couple years later he got arrested for wire fraud for an unrelated business). New management took over, changed the focus to become a healthcare specialist, and renamed it Sthealth Capital Corporation. One of the directors resigned in protest, and wrote a hilarious letter criticizing the management.

As of September 30, 2021, the last date for which it filed a 10-Q, StHealth had $2.6 million in gross assets, and with its only reported debt being accounts payables and accrued expenses, $2.2 million in net assets. That works out to about $0.55 NAV per share. About half its assets are in cash and the other half is in a messy grab bag of securities. The securities are about ⅔ biotech startups, and ⅓ “other trading securities”. The biotech startups are all Level 3 Assets, so we can’t really take their valuations too seriously. The other trading securities are all reportedly valued based on quoted market prices, although the 10-Q provides no specific detail on individual holdings. Moreover, there has been a lot of market volatility since September 30. If we value the securities at zero, then the net cash per share would be $0.21.

In March 2022, their auditor resigned, citing their decision to no longer operate in the BDC space. In May 2022. The CEO/President/CFO resigned, although he is keeping the chief investment officer role. A new person took over in all of those roles. This past week the chief compliance officer and general counsel resigned. They hired a new chief compliance officer from an outsourcing firm. Several Subsequent 8-Ks indicate StHealth has gone through several compliance executives in the past year. Seems no one in the compliance role wants to stay long.

STHealth Capital Investment Corp Tender Offer

Alternative Liquidity Capital has announced an offer to purchase up to 130,000 shares in StHealth Capital Investment Corp at a price of $0.10 per share. Alternative Liquidity Capital is a Delaware Limited Partnership and is not affiliated with STHealth. The Investment Manager for Alternative Liquidity Capital is related by common ownership to Ockham Data Group, the holding company for Alternative.Investments.

The Offer document provides this explanation for the offer price of $0.10:

In determining the Purchase Price, the Purchaser analyzed a number of quantitative and qualitative factors including: (i) the lack of a secondary market for resales of the Shares and the resulting lack of liquidity of an investment in the Company; (ii) the fact that the company is delinquent in its filing obligations with the SEC, and consequently there is considerable uncertainty as to the value of the Company’s assets; (iii) risks in the Company’s investment strategy and the estimated value of the Company’s assets; (iv) the costs to the Purchaser associated with acquiring the Shares; and (v) the Purchaser’s objective to profit from this Offer. Based on this valuation methodology the Purchaser has established a price of $0.10 per Share.

According to the Company’s Form 10-K for the period ended December 31, 2020:

“The Company’s shares are illiquid assets for which there is not a secondary market and it is not expected that any will develop in the foreseeable future. There can be no assurance that the Company will complete a liquidity event. Even if it does complete a liquidity event, Shareholders may not receive a return of all of their invested capital.” .

To the best of the Purchaser’s knowledge, there company does not have a current share repurchase program.

Additionally, to the best of the Purchaser’s knowledge, the company does not have a currently active share repurchase program. The illiquidity of shares means that Shareholders have limited alternatives if they seek to sell their Shares. As a result of such limited alternatives for Shareholders, the Purchaser may not need to offer as high a price for the Shares as it would otherwise. On the other hand, the Purchaser takes a greater risk in Purchasing Share because Purchaser itself will have limited liquidity for the Shares upon consummation of the purchase.

The Purchaser is offering to purchase Shares which are an illiquid investment and is not offering to purchase the Company’s underlying assets. Although there can be no certainty as to the actual present value of the Shares, the Company established an estimated net asset value per Share (the “Estimated Per Share NAV”) of $0.55 on December 13, 2021, representing the Company’s Estimated Per Share NAV as of September 30, 2021, according to its Form 10-Q- filed with the Commission on December 13, 2021.

The majority of the Company’s assets consist primarily of illiquid investments without a readily ascertainable market value. In its 10-Q for the period ended September 30, 2021, the company notes:

“Due to the inherent uncertainty of determining the fair value of investments that do not have a readily available market value, the fair value of our investments may fluctuate from period to period. Additionally, the fair value of our investments may differ significantly from the values that would have been used had a ready market existed for such investments and may differ materially from the values that we may ultimately realize. Further, such investments are generally subject to legal and other restrictions on resale or otherwise are less liquid than publicly traded securities. If we were required to liquidate a portfolio investment in a forced or liquidation sale, we could realize significantly less than the value at which we have recorded it.”

Since the Company has not current in its SEC filing obligations, there is additional uncertainty as to the value of the underlying assets.

The Company may publish an update to its Estimated Per Share NAV during the period in which this Offer is open. Shareholders should consult the Company’s public filings pursuant to the Securities Exchange Act of 1934, as amended (the “Exchange Act”), for any such updates, which are available at www.sec.gov. In the event that a Shareholder wishes to withdraw its tender of Shares as a result of such update, a withdrawal of tender may be effected pursuant to Section 5 – Withdrawal Rights.

As of the most recent available public filings, the Company’s assets consisted primarily of equity investments in private companies in the healthcare industry. The Company is therefore subject to industry specific risks. In purchasing the shares, the Purchaser will be exposed to risks in the healthcare sector . Declines in the healthcare industry and/or in specific investments in the Company’s investment portfolio could impact the Company’s ability to pay cash distributions.

Before deciding whether to sell your shares to Alternative Liquidity Capital, shareholders are urged to obtain relevant valuations for the shares and are urged to consult with their financial advisor.

If you have any questions feel free to contact the purchaser at info@alternativeliquidity.net or (888) 884-8796. Visit Alternative Liquidity’s website to learn about how you can get cash for your illiquid investments.

BDCs

5 Benefits of Non-Traded BDCs

Non-traded BDCs are an investment structure that allow investors to access investments in small and medium sized businesses. They can be invest in equity or debt, and focus on providing long term capital gains or income. In practice most non-traded BDCs invest in credit and seek to provide consistent income. In recent years, there has been a surge in investor interest in NT BDCs.

Why should anyone invest in a non-traded BDC? Why not just invest in an exchange traded BDC. In this article, we outline five fundamental benefits that are unique to non-traded BDCs.

Access to Institutional Private Credit Strategies


Private credit can play an important role in portfolio construction by providing diversification, reducing volatility, and enhancing long term returns. However, traditionally many of the best private credit funds have only been available to institutions and large family offices. Private credit funds usually have minimums, high investor accreditation requirements, complicated tax forms, and limited liquidity. However a non-traded BDC makes this type of investment available to a wider audience.

Many non-traded BDCs allow investors to start with as little as $2,500. Unlike private placements, NT BDC investors receive simple 1099 tax filings. Furthermore, non-traded BDCs have more consistent liquidity options than private placements.

Capital Raise Across Market Cycles


The benefits of a continuous capital raise area s subtle and rarely discussed, yet we believe they are one of the key advantages of the non-traded BDC structure. The best opportunities to invest occur during moments of market panic. Yet during times of market panic, publicly traded BDCS generally trade at a discount to NAV. BDCs are forbidden from issuing new shares at a discount to NAV, so they will be cut off from raising capital at the exact moment that they have the best opportunities to invest. This phenomenon was readily apparent during the 2009 global financial crisis, and the 2020 Covid mini crash. In contrast, non-traded BDCS that continuously raise capital are able to deploy capital best when times are most favorable.
The unlisted BDC structure offers flexibility that traded BDCs don’t have.

Emotional Management


The average investor return in a mutual fund is far lower than the actual return achieved by a mutual fund. How is that possible? Because retail investors too often react emotionally to market volatility, selling at the bottom, and buying at the top. The non-traded BDC structure puts in a barrier to slow down emotional reactions, potentially preventing their financial consequences.

Although non-traded BDCs offer some liquidity options(typically quarterly), the extra stop gap helps investors better manage emotions. This is also valuable for financial advisers trying to encourage prudent behaviour in their clients. With NT BDCs, investors are more likely to achieve the best possible returns from holding any given fund over a market cycle.

Long Term Emphasis


Managers of listed companies may talk about the long term, but in reality they are typically driven by short term share price pressure. In contrast, the manager of a non-traded BDC can focus on long term opportunities without the short term pressure of the stock price. As a result, an unlisted structure is a better fit for more complex, and potentially lucrative investment strategies.

Transparency


Alternative investments have historically had a reputation for opacity. If you invest in a private equity fund or hedge fund, often you are unable to see specific details on underlying investments. However all NT BDCs are registered under the 1940 act, and consequently must provide regular updates in SEC filings. In fact, NT BDCs file the same quarterly and annual reports as publicly traded companies in the SEC’s EDGAR database

These public filings contain a wealth of information. Alternative.investments is a resource you can use to make the best use of it. Transparency is an important benefit of non-traded BDCs.

FS Energy and Power

Alternative Liquidity Capital Announces Offer to Purchase Shares in FS Energy & Power Fund

Alternative Liquidity Capital is providing an opportunity for investors in FS Energy & Power Fund to sell their shares. Here is a copy of the recent press release summarizing the offer.

Alternative Liquidity Capital has announced an offer to purchase up to 1,000,000 shares in FS Energy & Power Fund (the “Company”).

The Company’s share repurchase program has been suspended since March 2020 and may continue to be for an indefinite period of time Consequently, liquidity is extremely limited for shareholders. The Offer provides an opportunity for legacy investors to exit their investment in the Company. Unless extended, the Offer will Expire on September 20, 2022.

The Purchaser is a Delaware Limited Partnership and is not affiliated with the Company. The Offer is being made solely for the Purchaser to establish a passive ownership position in the Company.

Shareholders should read the Offer and related material carefully because they contain important information. Shareholders are urged to consult with financial and other professional advisors before making any decisions regarding the Offer. This announcement is intended as a notification that the Offer has been made, and does not constitute an invitation to sell. Any action that any Shareholder may take in relation to the Offer is only able to be taken once they receive a copy of the Offer which contains the applicable terms and conditions.

Shareholders may obtain a free copy of the Offer and Assignment Form without charge by visiting Alternative Liquidity Capital’s website at: https://www.alternativeliquidity.net or by calling (888) 884-8796. Investors may also contact the Purchaser at info@alternativeliquidty.net to answer questions about the Offer or to obtain Offer documents.

Alternative Liquidity Capital will also purchase other non-traded alternative investments. If you illiquid assets you are looking to sell please contact info@alternativeliquidity.net

Traditional Asset Managers buy Alternatives

Why Traditional Asset Managers Need Alternative Investments

The core thesis behind the creation of this site is that alternative investments are no longer alternative- they are an essential part of any portfolio. The Financial Times recently published an article highlighting a key trend that supports this thesis:

Fund houses buy up ‘alts specialists’

The $100 billion Club

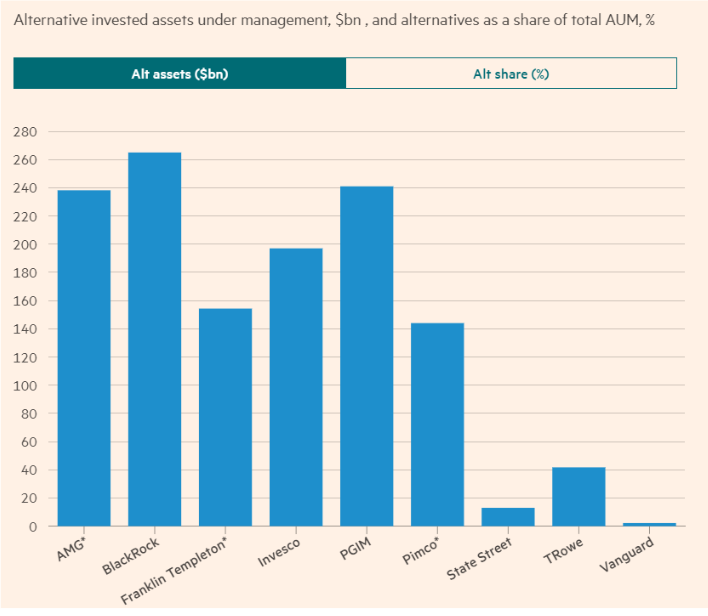
According to the FT, more than a dozen fund groups known for mutual funds and ETFs reported at least a $100billion in alternative assets at the end of 2021.  These include firms such as BlackRock, Franklin Templeton Pimco, and Invesco.   

This chart shows the amount of alt assets at a few major firms.

Traditional Asset Managers buy Alternatives

The original article has an interactive version of this chart. 

There are basically two ways mutual fund and ETF focused asset managers can expand into alternatives- build it or buy it. However, the latter method- asset manager M&A, is what seems to be making the biggest splash in the industry. For example, AllianceBernstein announced plans to purchase CarVal Investors, building its alternatives business to nearly $50 billion. Franklin Templeton is buying Lexington Partners, increasing its alternative asset AUM to $200 billion.

Why traditional asset managers need alternative investments

Why are traditional asset managers so keen to buy alternative asset managers? The key reason is investor demand. Institutional investors have all been increasing their allocation to private lending, private equity real estate, infrastructure, and private equity in recent years. A recent survey found that 86% of institutional limited partners intended to invest the same or more money in private capital in coming years.

So the institutional channel is big and growing. But the real story is the “mass affluent” retail investor demand for alternative funds:

The fund mangers also hope to capitalise on an expected wave of interest from wealthy retail clients looking for stable long-term returns at a time when bonds and equities have been volatile. Some envy the success of alternative managers in introducing products for the very rich, such as real estate and credit funds launched by BlackStone, the worlds largest private equity group.

Industry Impact

Most people don’t think of firms like BlackRock, Franklin Templeton, Pimco, or Invesco as alternative asset managers, yet they are starting to shift their focus. BlackRock CEO Larry Fink ‘s annual letter to shareholders mentioned that plans to accelerate growth in private markets were central to the group’s strategy. The entrance of large traditional fund managers into the retail alternative channel is going to dramatically alter the shape of the industry. They will open up new sales channels for alternative products, while also raising the bar in terms of quality and transparency.

In fact, traditional asset managers have already started to make a major impact on key niches of the alternative fund management industry, such as non-traded REITs and interval funds. The Blackrock Credit Strategies Fund is a closed end interval fund that launched in 2018. It now has $428.2 million in assets. When Franklin Templeton bought out Benefit Street Partners, they took over management of a non-traded REIT, now known as the Franklin BSP Real Estate Trust . The Invesco Senior Loan Fund is one of the longest running interval funds. Research at Interval Fund Tracker highlighted how well it weathered the global financial crisis of 2008-2009. The Invesco Dynamic Opportunities fund was previously a traditional exchange traded closed end fund, but it converted to an interval fund while staying on the exchange.

Private Equity Goes Mainstream

Private Markets Go Mainstream

The latest issue The Economist features a special report on Private Markets. This report provides broad historical context to the current boom in private equity, real estate, and other alternative assets. It analyzes the tailwinds that have driven record amounts of capital into private markets, and the risks and opportunities the industry is facing in the near future. Its a must read for anyone interested in alternative investments. As we’ve noted several times before- alternative investments have gone mainstream.

The article discusses how the pioneers of leveraged buyouts transformed and reinvented themselves into diversified alternative investment platforms with exposure to a wide range of assets. One section in particular focuses on how asset managers that traditionally focused on high end institutional clients are now focusing on marketing to mom and pop investors.

Quoting from the article:

The PE giants are hustling for high-end retail business from clients who count as “accredited” investors whom regulators deem sophisticated enough to buy private assets.  The big firms are also strengthening private-wealth teams, in some cases poaching from banks. Alisa Wood of KKR says the firm is looking to raise a third or more of its capital from retail investors. Apollo expects individuals and advisers to invest $50bn over the next five years. To that end, in December Apollo acquired part of Griffin Capital, a Los Angeles -based fund manger. The next target is the “mas affluent”, or merely quite well off, who have little invested in private markets and want more.  Several firms, including Blackstone and Brookfield, have launched or are working on PE, credit, property or infrastructure funds tailored to smaller investors. 

Product Innovation to Meet Retail Needs

These new investment products cover a wide range of asset classes, and can come in a wide range of product wrappers. Interval Funds and Tender Offer Funds have become more common in recent years. Non-traded REITs and Non-traded BDCs are also important structures, especially for real estate and credit exposure. Regardless of the wrapper, asset managers need to innovate to create solutions that meet retail investor needs. Two important challenges are the need for liquidity, and the need for transparency.

One difficulty over turning this retail trickle into a flood is illiquidity.  REtail investors want to trade in and out of investments at a reliable net asset value, if not daily then weekly or monthly. That is not easy to engineer with private assets. Some a the cutting edge are making headway.  Swiss-headquartered PArtners Group manages over $36bn in open-ended PE funds for investors including wealthy retail clients. Investors receive monthly net asset values and can redeem ata 30-90 day notices(although funds can halt redemptions during market turmoil).  

For more information about Partners Group and their massively successful closed end fund products, check out this article on TenderOfferFunds.com

Business Strategy

Meeting retail investor needs is an essential part of the long run business strategy for all major alternative asset management firms. As the article notes:

The retail pus aims both to increase clients and to grow fee based revenues. This goes hand in hand with the objective of raising more “perpetual” capital. Not only are profits from traditional PE funds erratic, but also the funds have to be wound up, typically after ten years. Big firms want to move away from this here-today-sold tomorrow model. They like vehicles that can invest for longer, or are open-ended. , avoiding the need to go cap in hand to investors every few years.

A lot of alternative asset managers are publicly traded, and also need to consider how the public markets view fee streams. In general, asset managers with a higher percentage of base management fees from permanent capital vehicles will command a higher valuation.

See also: Why Traditional Asset Managers Need Alternative Investments

Oaktree Non-Traded BDC

Oaktree Launches Non-traded BDC : Oaktree Strategic Credit Fund

Oaktree Capital filed a registration statement for a new non-traded BDC: Oaktree Strategic Credit Fund. Oaktree is joining Bain Capital, Apollo, and Blackstone by making high net worth retail investors an important part of their fundraising strategy. In this article we provide a preview of Oaktree’s new non-traded BDC.

Oaktree Strategic Credit Investment Strategy

According to the prospectus, Oaktree Strategic Credit will focus on private debt opportunities, mainly in US companies. The prospectus also allows them to invest in European companies. However, to maintain compliance with the regulatory requirements of a business development company, they must put at leas ty70% of their assets in private US companies. Most of their debt investments will be non rated. They will invest opportunistically, so the investment portfolio will change with market conditions. Oaktree believes the market for lending to private companies is underserved. Key themes they will focus on will be stressed sector/rescue lending, situational lending, sponsor related financing, secondary private loans, and loan portfolios.

Fund Structure

Oaktree Strategic Credit Fund has a maximum capital raise of $5 billion The latest prospectus includes three classes of shares: Class S, Class D, and Class I . Class S shares will have a servicing/distribution fee of 0.85% per year, with a 3.5% cap. Class D wil have a shareholder servicing/distribution fee of 0.25% per year with a 1.5% cap. Class I shares will not have any shareholder servicing or distribution fees. The minimum initial investment for Class I shares is $1 million.


Oaktree’s new BDC will have a base management fee of 1.25% per year. Additionally, it will charge an incentive fee consisting of two parts. The first part of the incentive fee is based on income- the manager will receive 12.5% of pre incentive fee net investment income over a 5.0% hurdle rate. Additionally, the fund will pay the manager 12.5% of cumulative realized capital gains.

Notably this fee structure is nearly identical to that of Apollo’s new non-traded BDC.

About Oaktree Capital

Oaktree Capital Management is a global alternative asset manager with more than $158 billion in AUM as of 9/30/2021, according to its website. They have deep expertise across the capital structure. They organize their investment professionals into four broad categories: credit, private equity, real assets, and listed equities. Well known for their expertise in distressed debt, approximately 69% of their assets are in credit. Their clients include 67 of the 100 largest pension plans in the US, 40 state retirement plans along with 15 major sovereign wealth funds and 500+ corporations around the world. In 2019 Brookfield Asset Management acquired a majority interest in Oaktree. Oaktree entered the non-traded REIT space back in 2017. After transitioning the management over to Brookfield, this REIT has over $500 million in net assets. It is likely Oaktree will quickly gain market share in the non-traded BDC industry.

Looking for data on non-traded BDCS? Click here to access our free tools and data.

Apollo Debt Solutions BDC

Fund Launch: Apollo Debt Solutions BDC

Apollo Global Management has launched a new non-traded BDC: Apollo Debt Solutions BDC. The SEC declared the Apollo’s new BDC effective on October 29, 2021.

Investment Strategy

According to the prospectus for Apollo Global Debt Solutions:

Our investment strategy is focused on sourcing deals directly with large private U.S. borrowers who seek access to financing and who historically relied heavily on bank lending or capital markets. We believe there is a market opportunity for these large private U.S. borrowers.

They will focus on companies with at least $75 million in EBITDA, but they might adjust this threshold for market disruptions, M&A related charges and synergies, etc. Quoting from the prospectus again:

We believe this opportunity set generates favorable pricing and more rigorous structural protections relative to that offered by investments in the broadly syndicated markets. From time to time, we may also invest in loans and debt securities issued by corporate borrowers outside of the private large borrower space to the extent we believe such investments enhance the overall risk/return profile for our shareholders and help us meet our investment objectives.

The fund was launched as a blind pool, but they already had a financing facility agreement on the date of the launch.

Apollo Debt Solutions Fund Structure

Apollo Debt Solutions BDC has a maximum capital raise of $5 million. The latest prospectus includes three classes of shares: Class S, Class D, and Class I . Class S shares will have a servicing/distribution fee of 0.85% per year, with a 3.5% cap. Class D wil have a shareholder servicing/distribution fee of 0.25% per year with a 1.5% cap. Class I shares will not have any shareholder servicing or distribution fees.

Apollo’s new BDC will have a base management fee of 1.25% per year. Additionally, it will charge an incentive fee consisting of two parts. The first part of the incentive fee is based on income- the manager will receive 12.5% of pre incentive fee net investment income over a 5.0% hurdle rate. Additionally, the fund will pay the manger 12.5% of cumulative realized capital gains.

About Apollo Global Management

Apollo is a leading global alternative asset manager with approximately $480 billion in AUM, according to a recent investor presentation. Apollo Global Management is listed on the NYSE under the symbol APO. They have three main business segments: Private Equity, Credit, and Real Assets. IT believes it is distinct from other alternative managers in the way it operates its three primary business segments: private equity, credit, and real assets, in an integrated manner. Apollo has been part of a broader trend of institutional alternative managers making the big shift into the retail channel. On recent conference calls, management has hinted at early success raising capital from retail investors.

Apollo Debt Solutions will be a good fund to watch in the coming months. Blackstone’s non-traded BDC has over $18 billion in assets. It will be interesting to see if Apollo achieves similar fundraising success.

Want to learn more about non-traded BDCS? Click here to access free tools and data.

«‹ 2 3 4 5›

Back to Top

  • Privacy Policy
  • About
  • Contact
  • Terms of Service
© 2025 Diligent Research LLC